Your landing page is up and running! You spent hours in a landing page creator designing the best landing page imaginable. You’re pleased with its design, and you have high expectations that it will work.
It’s a good first sign. However, it is not the end of the process. It’s now time to measure landing page KPIs to track its results and performance. Does your landing page convert users well?
You may wonder which KPIs you should measure to get the answers and which metrics matter. We’ll give you a rundown of key metrics that you should pay the most attention to.
Open up your analytics tools and let’s get started.
What KPI stands for?
Let’s begin with the KPI definition.
KPI stands for Key Performance Indicator. It is a quantifiable and measurable metric used to track progress and performance over time for a specific goal. In online marketing, KPIs are used to understand page metrics. Analyzing them shows channels with the potential to improve and, in turn, give you more conversions.
What is a landing page KPI?
Knowing your landing page performance metrics may influence your ability to use your page potential most.
Just as a brief reminder, a landing page key performance indicator (KPI) is defined as a value that demonstrates how effectively your landing page achieves key business purposes. Organizations use KPIs in many ways to evaluate their progress towards achieving targets.
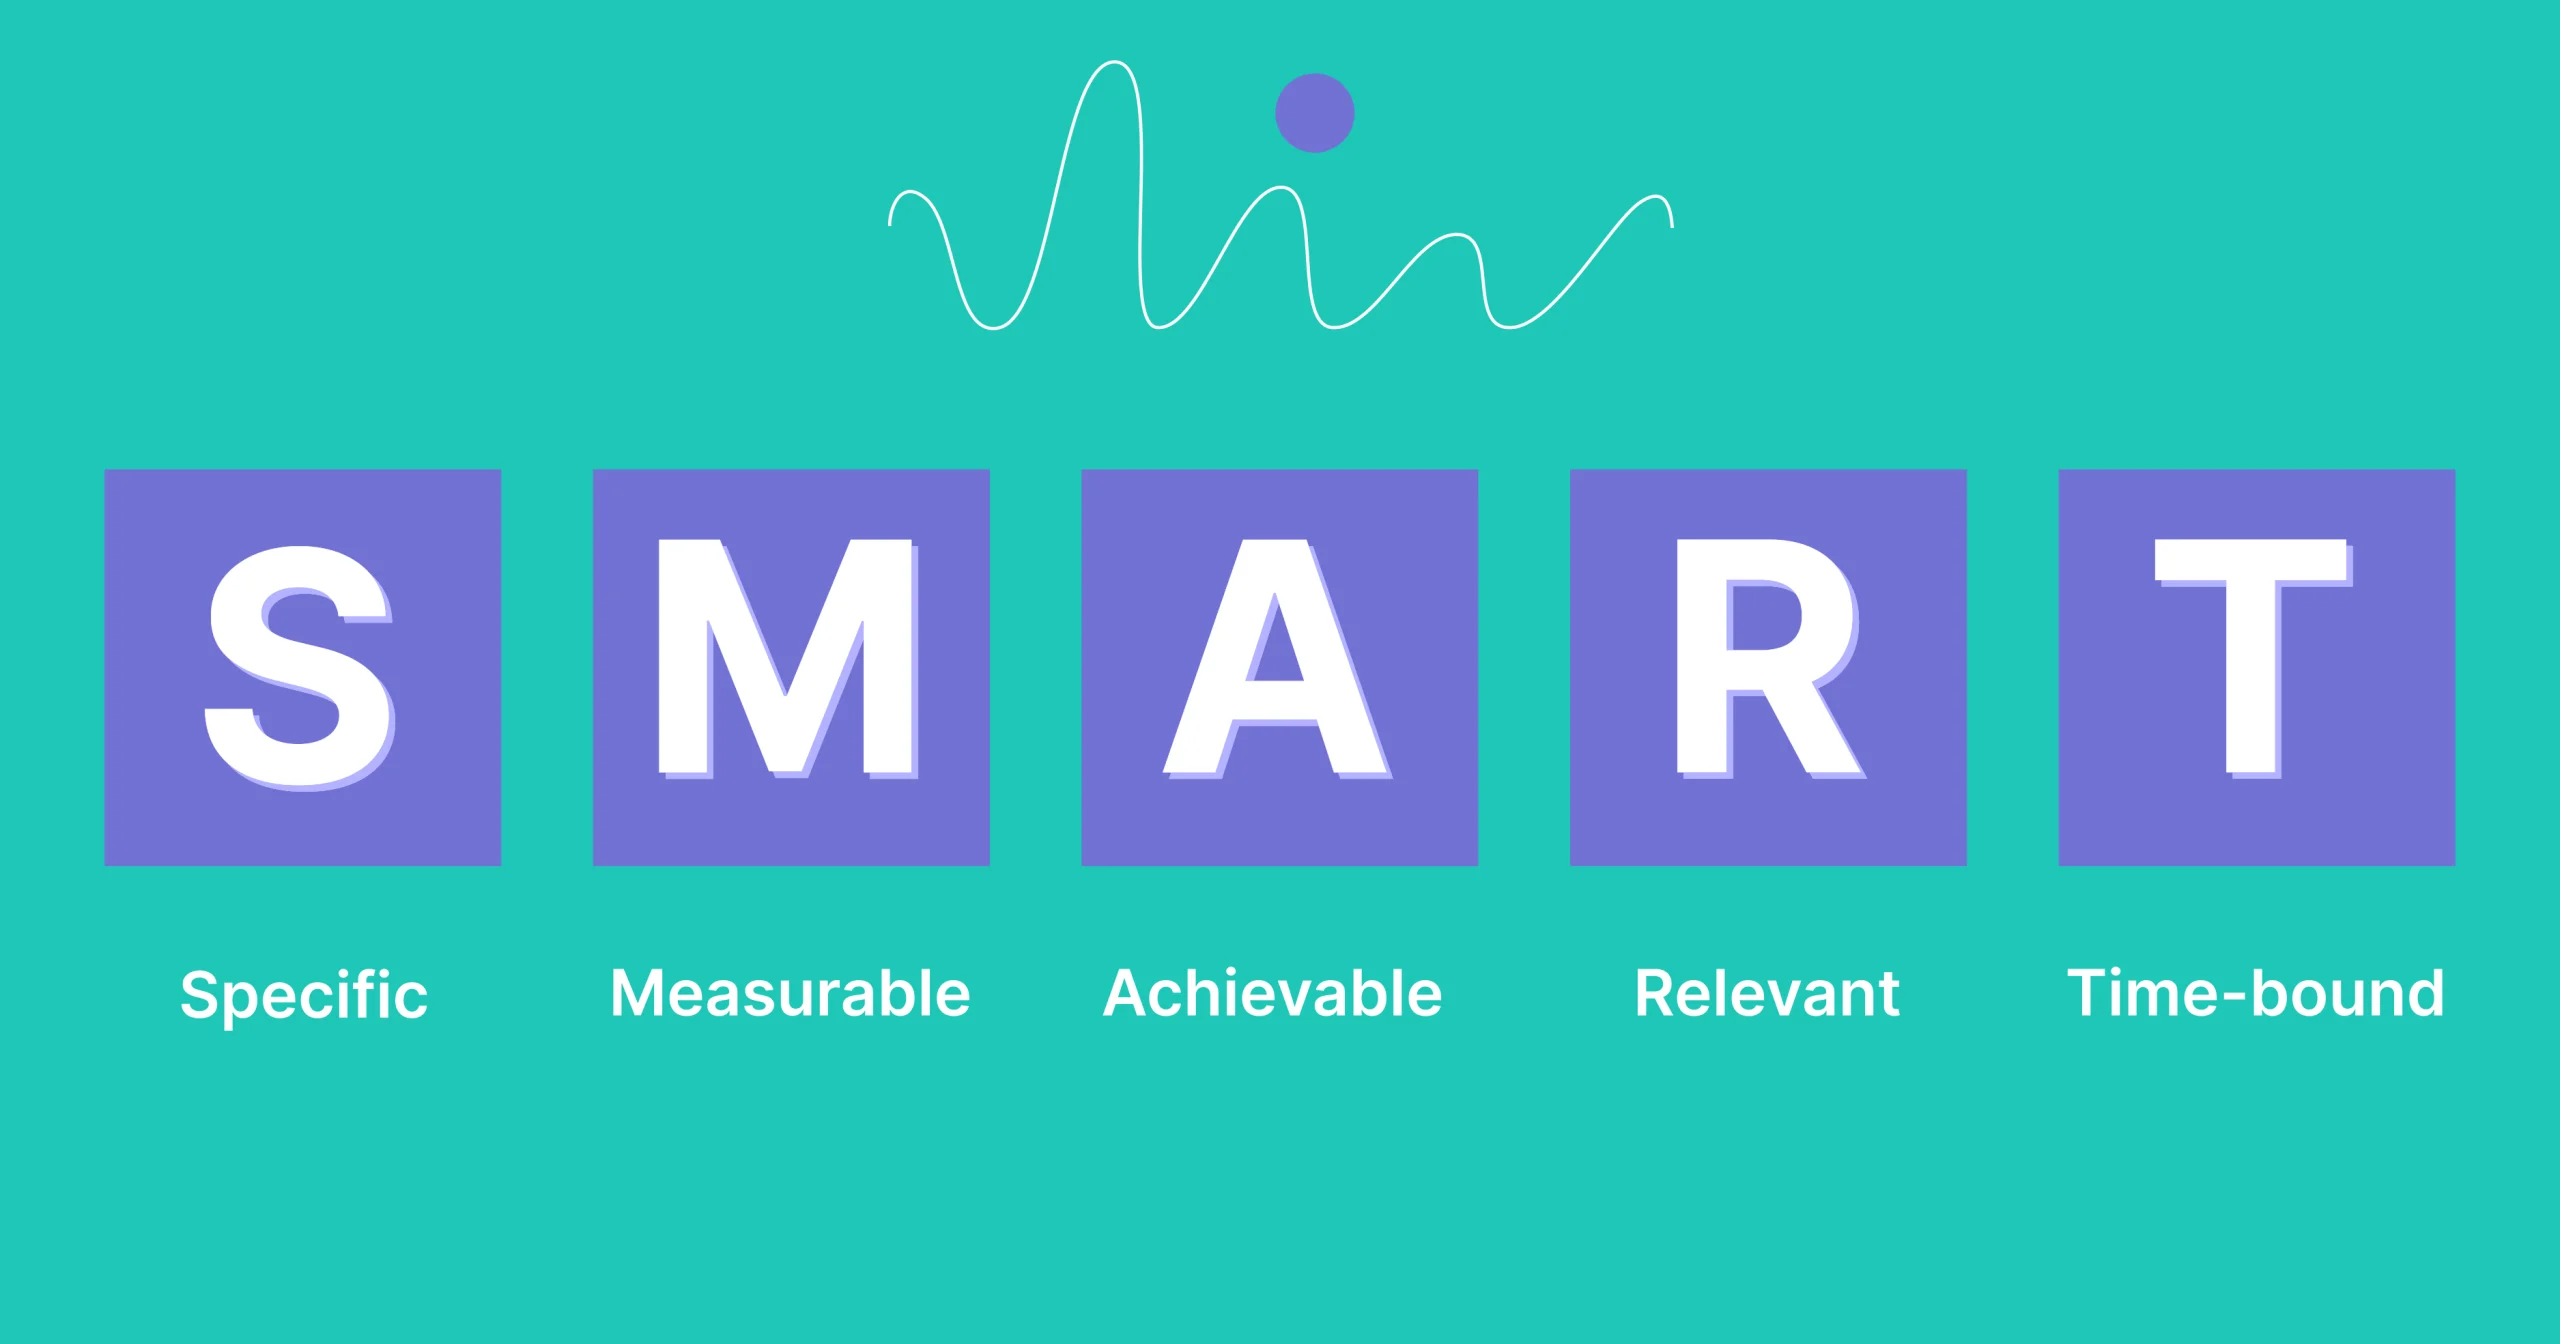
One way to evaluate a KPI’s relevance is to use the SMART criteria:
- Is your goal specific?
- Can you measure the progress?
- Is the goal realistically achievable?
- Is it relevant to the success of your landing page?
- What is the timeline for achieving this goal?
The most important landing page KPI
Marketers strive to be data-driven, but considering data without context might lead them in the wrong direction. Before you decide which maerketing metrics you want to (and should) track, you need to ask yourself once again:
What is the main purpose of your landing page?
A landing page is a site that is designed to convert visitors into leads. That is why the most critical landing page KPI is the conversion rate.
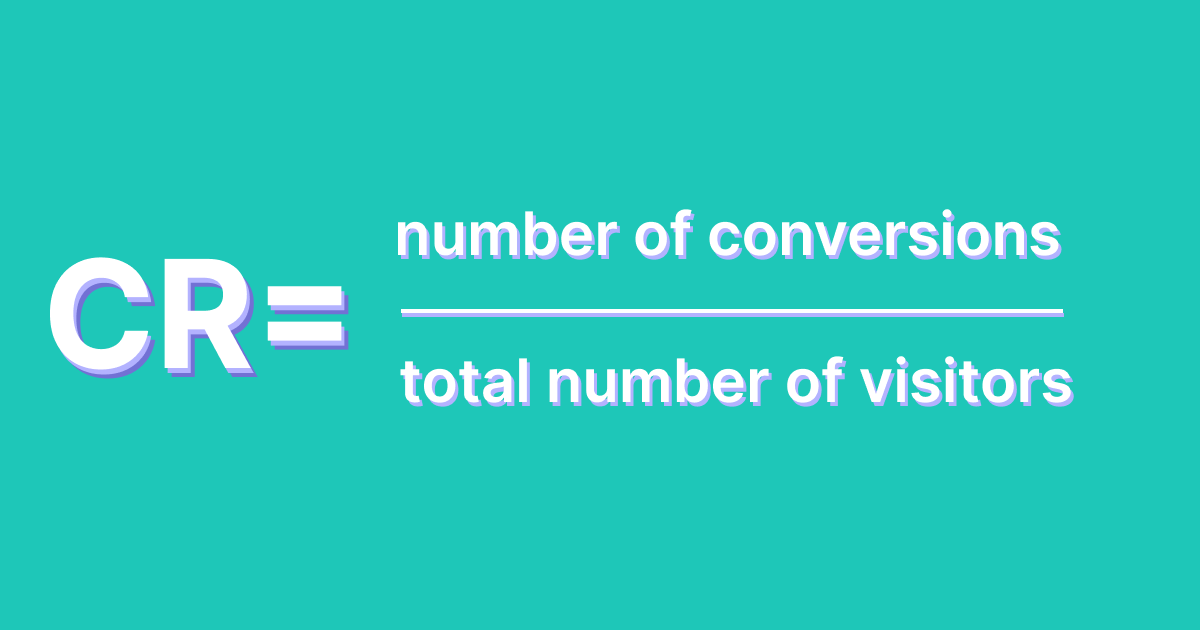
Conversion rate is the percentage of visitors who take the desired action on your landing page, e.g. fill in a form, leave contact details, or sign up for a newsletter.
Every landing page needs a call to action (CTA) – an incentive that leads visitors to make a specific move. Conversion rate is the primary metric that will show you how well your audience responds to that incentive. It will tell you if your landing page performs well and, therefore, whether it needs improvement.
What is the average landing page conversion rate?
How do you know if your landing page conversion rate is high enough? High is a relative term in terms of the conversion rate, and is greatly influenced by the specific industry, campaigns, and goals.
The average landing page conversion rate across all industries is 2.35%. However, you need to know that there’s a big difference between the best and worst performers – the top 10% have almost 5x higher conversion rates than the average. You should find information about your industry’s average conversion rate in order to set a realistic target.
Benchmarking your site’s results can help provide insights into how well it is performing, but understanding what a “good” conversion rate looks like might be challenging. That is why you should have the big picture of your performance and look at it through multiple landing page KPIs. Which ones give you the most information about your landing page?
1. Landing pageviews
It’s the first of the key landing page metrics after conversion that you should look into, and one of the most common that marketers track. How many times has your landing page been viewed? A landing page is the cornerstone of any marketing campaign, so you should find out how many people visit your page and how that number changes with time.
Pageviews: Number of page views in the measured timeframe.
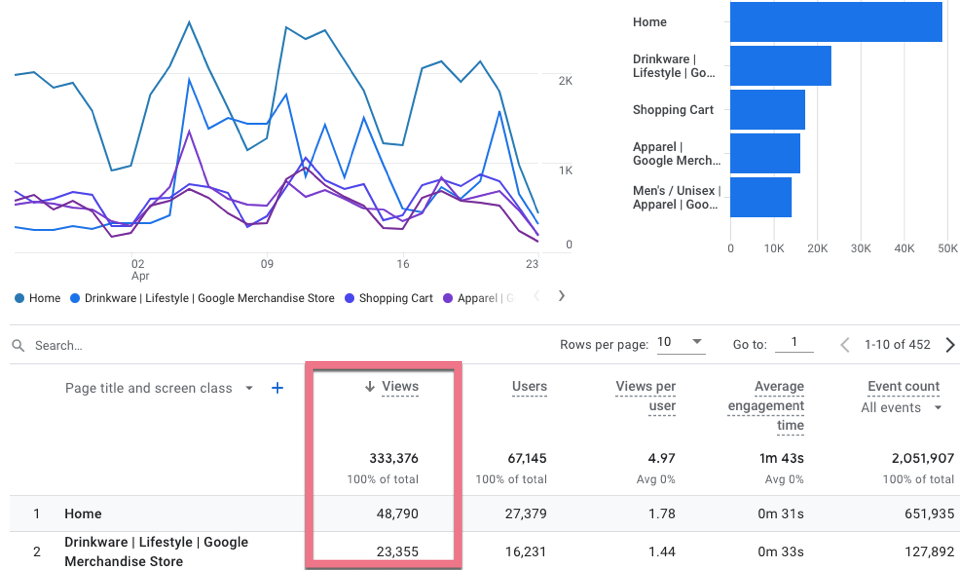
Pageviews is an important landing page KPI because:
It will show you how well your landing page is optimized for searches.
It reveals viewers’ trends – filtering by date can let you know whether e.g. the weekday or weekend influences the number of visitors.
You can see which landing pages give you the most views and decide which you should optimize.
Optimizing those views is a great way to boost the quality of the landing page traffic you receive from ads.
Pageviews are a good starting point for exploring where views come from and what visitors did after viewing the page.
TIP: How to access landing page views metrics in Google Analytics 4?
You can check landing page views in GA4 by clicking on Reports -> Life cycle -> Engagement -> Pages and screens. Check our guide on integrating Google Analytics 4 and Landingi.
What is the difference between Pageviews and Unique Pageviews?
In Google Analytics, a pageview is counted as whenever a visitor lands on your landing page or reloads the page. Unique Pageview simply puts together all page views that are from the same person and are related to the same page or session. Go to our Help Center to read about landing page visits, pageviews, and sessions.
2. Bounce Rate
This landing page KPI provides insight into traffic analysis. But what does the bounce rate mean exactly?
Bounce rate: the percentage of visitors who view a landing page and leave without taking another action.
What does bounce rate mean in practice? A visitor leaves a landing page by:
- clicking “back”;
- closing the browser/tab;
- staying inactive for more than 30 minutes;
- typing in a new address without interacting with the page;
- clicking on an outbound link.
The average bounce rate on landing pages varies from 60% to 90%. If you aim to increase conversions, you need to decrease the bounce rate as much as possible.
If your bounce rate is too high, you need to consider your landing page user experience:
- Check whether your landing page is intuitive and dynamic, keep it simple, and match ads to it.
- Review SEO best practices in case visitors unintentionally reach your landing page after organic-searching for something unrelated.
- Ensure that your landing page is optimized for mobiles, as people are more likely to bounce sooner on them than on other devices.
- Make your landing page load faster.
Analyze why visitors don’t want to take the expected action and optimize your landing page according to the conclusions.
Remember! You should interpret the bounce rate for each landing page individually. There is no single formula because it all depends on the primary purpose of the page. A high bounce rate doesn’t always mean that something is wrong – if a visitor leaves a landing page, it does not necessarily indicate that they did not find anything valuable on the site.
3. Average Time on Page
Monitoring how long visitors stay on your landing page is an important indicator, and it says a lot about landing page success, especially if your page has educational value. If people spend a long time on your page, that means it is informative and provides them with valuable data.
Average Time on Page: as the term indicates, it shows the average amount of time users spend viewing your landing page.
However, a longer or shorter time spent on a landing page doesn’t necessarily mean something is wrong with it. Again, consider the average time in light of landing page goals and purposes. Visitors will probably spend more time on an educational landing page than a conversion-driven one.
If you think visitors don’t spend enough time on your landing page, consider:
- lengthening the landing page’s content
- adding engaging content like videos
- whether or not the design appeals to readers and makes them stay longer (if you used a landing page builder to create your site, you can make changes in minutes).
4. Traffic Source
Knowing where your visitors come from is essential when it comes to landing page analysis. These metrics tell you which marketing campaigns are working and which are no longer worth investing in, and that in turn will help you make a decision regarding which channel you should concentrate on to increase the number of landing page conversions.
How can you drive more traffic to your landing page?
Once you know where your visitors were before they reached your landing page, you can focus on making improvements.
How can you find more traffic to your landing page?
- pay-per-click (PPC) ads
- social media
- organic searches
- email marketing
- content marketing.
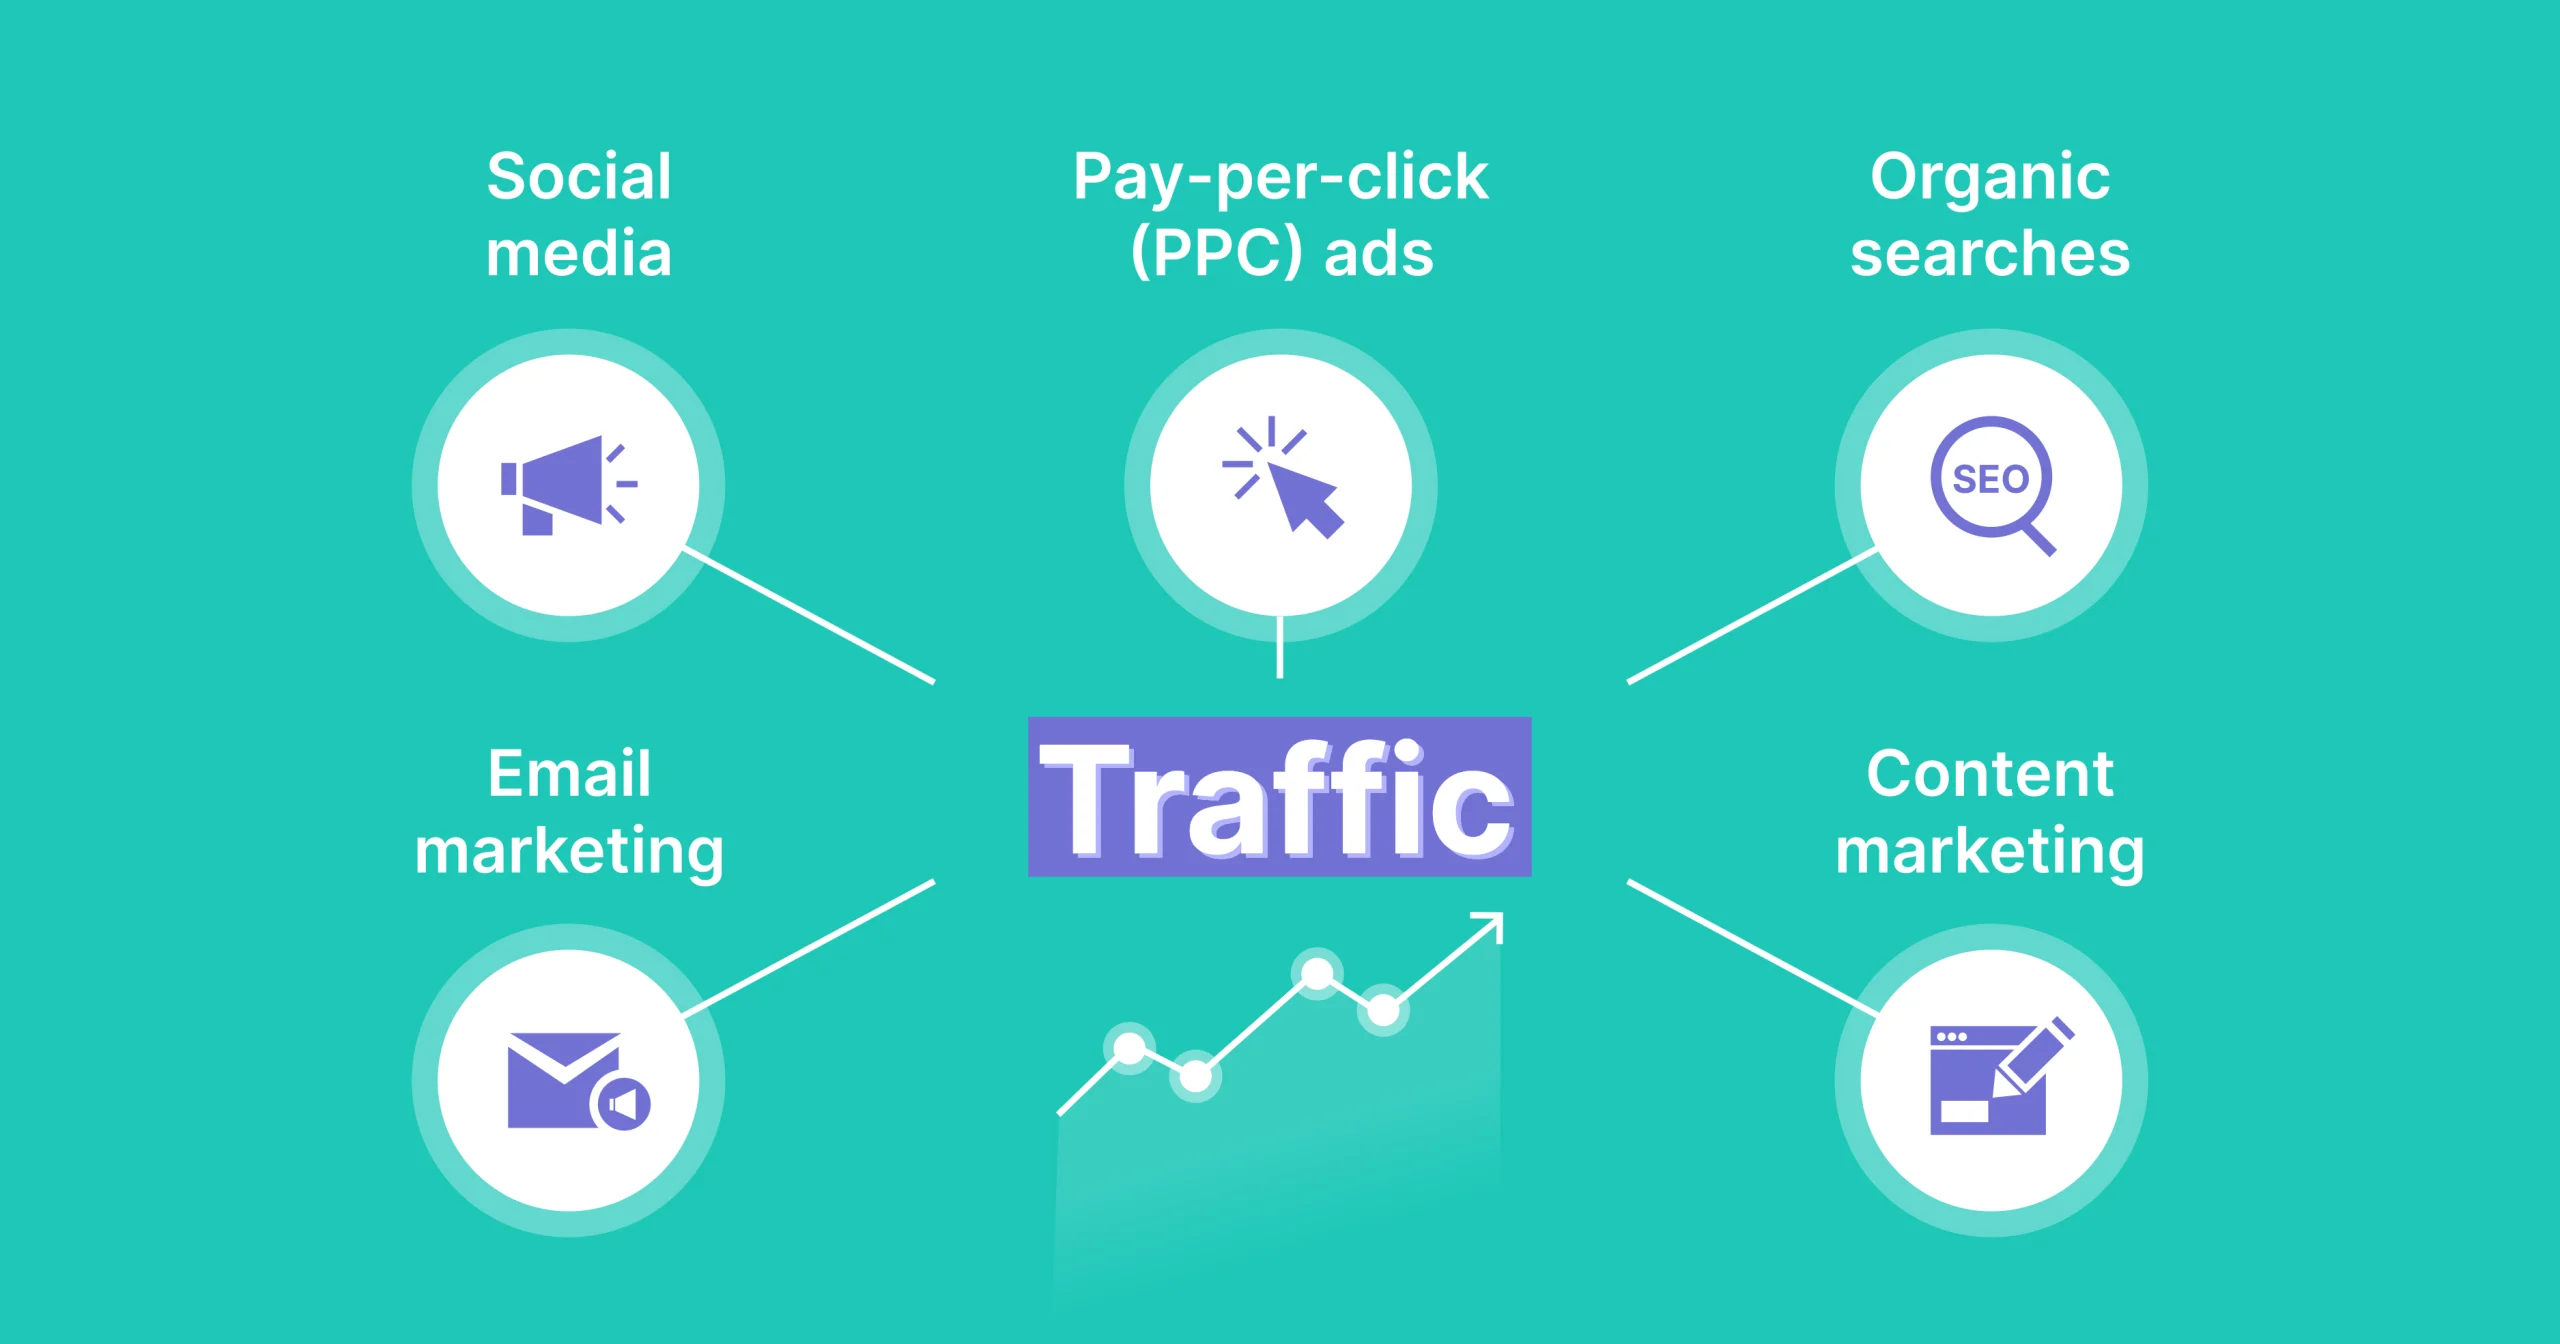
Generating traffic can be highly effective within those sources. Use them purposely: create valuable content, optimize for search engines, and promote yourself on the most popular social media channels. Consider hosting a webinar, adding social share buttons to your content, or starting an online community – there are lots of opportunities awaiting.
Traffic sources are the foundations of your marketing funnel, and they will determine the quantity and quality of your leads. So ensure that you put a lot of effort into them in order to gather a tailored audience.
5. Form Abandonment
Most conversion-focused landing page examples include five basic elements: strong headlines, eye-catching content, engaging copy, CTA buttons, and contact forms. The last one has a great impact on turning a visitor into a lead.
That is why form abandonment is a key landing page KPI that will show you how many people resign at the final hurdle.
Form Abandonment: the percentage of visitors who were filling out the required information but left the page before finishing.
What does a high abandonment rate mean? That your contact form may be too sensitive or too long to fill out. A great landing page stands out thanks to keeping a form as short as possible and requiring only the most essential information.
Even if you have a WordPress landing page, you can set up A/B tests to see which form works better. By analyzing test results and measuring landing page metrics, you can conclude what information people are willing to share and adjust the fields accordingly.
6. Conversion Goal
If you use Google Analytics to track your landing page metrics, you should know that you can set up your goals there. Doing so can help you keep track of conversions and see how their rates fluctuate, as well as if they are close to the target.
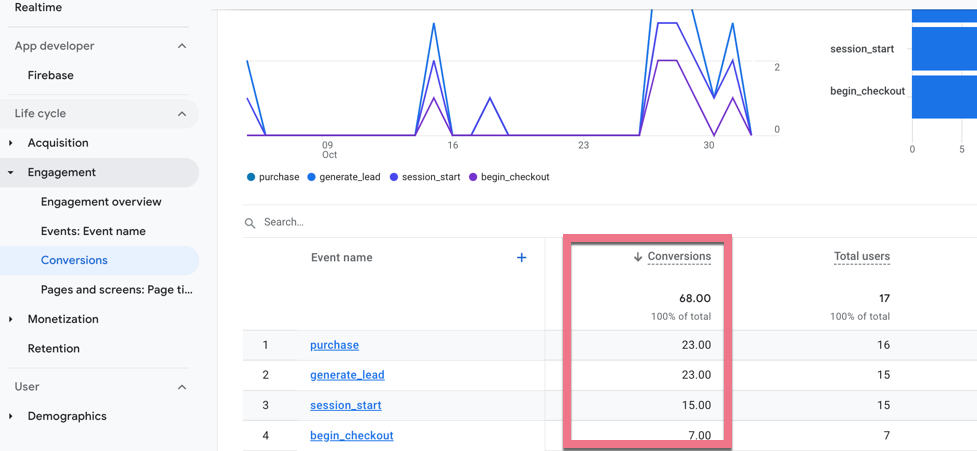
TIP: You can see your set goals in Google Analytics by clicking on Reports -> Life cycle -> Engagement -> Conversions.
7. Return and New Visitors
This metric shows the percentage of return and new visitors. It is often ignored yet can offer important information about your page’s engagement.
How to understand this metric? It is as easy as it seems. Return visitors are those who have been to your landing page before and returned. New visitors are those who land on your page for the first time ever.
Analyze the amount of returning and new visitors in conjunction with other metrics – it will give you even more information about landing page performance. For example, if your return visitors have a higher bounce rate than new ones, it may be because your content does meet their expectations anymore – in quality or quantity.
Keep analyzing landing page metrics
Creating a landing page does not end with its launch. You should actively measure its performance to get the answer to the most crucial question: are your campaign and the landing page successful?
Correctly set landing page KPIs are like all marketing metrics: they need to be analyzed as a whole. Only by carefully examining each can you discover the relationships between them. Ensure that you regularly test and optimize your landing page to be sure that all elements are in the right place and that your landing page is ready to succeed.


